何为DEBUG?
相信很多程序员都知道debug这个单词,也明白它的意思,但是对于这词的由来,恐怕少有人知道。关于debug的由来,要追溯到1937年。1937年,美国青年霍德华.艾肯找到IBM公司为其投资200万美元研制计算机,第一台成品艾肯把它取名为:马克1号(mark1),又叫“自动序列受控计算机”,从这时起IBM公司由生产制表机,肉铺磅秤,咖啡研磨机等乱七八糟玩意儿的行业,正式跨进“计算机”领地。为马克1号编制程序的是哈佛的一位女数学家格蕾丝·莫雷·赫伯,有一天,她在调试程序时出现故障,拆开继电器后,发现有只飞蛾被夹扁在触点中间,从而“卡”住了机器的运行。于是,霍波诙谐的把程序故障统称为“臭虫(BUG)”,把排除程序故障叫DEBUG,而这奇怪的“称呼”,后来成为计算机领域的专业行话。从而debug意为程序除错的意思。
官方给出的步骤:
[Zero-configuration Web Application Debugging with Xdebug and PhpStorm](http://confluence.jetbrains.com/display/PhpStorm/Zero-configuration+Web+Application+Debugging+with+Xdebug+and+PhpStorm)
**运行环境:** PHPSTORM版本 : 8.0.1 PHP版本 : 5.6.2 xdebug版本:php\_xdebug-2.2.5-5.6-vc11-x86\_64.dll ps : php版本和xdebug版本一定要相对应 [点击下载Xdebug](https://xdebug.org/download.php)1. PHP安装xdebug扩展php.ini的配置,下面的配置仅供参考,路径要换成自己的!
[xdebug]zend_extension="D:\wamp\php-5.6.2-x64\ext\php_xdebug-2.2.5-5.6-vc11-x86_64.dll"xdebug.remote_enable = Onxdebug.remote_handler = dbgpxdebug.remote_host= localhostxdebug.remote_port = 9000xdebug.idekey = PHPSTORM 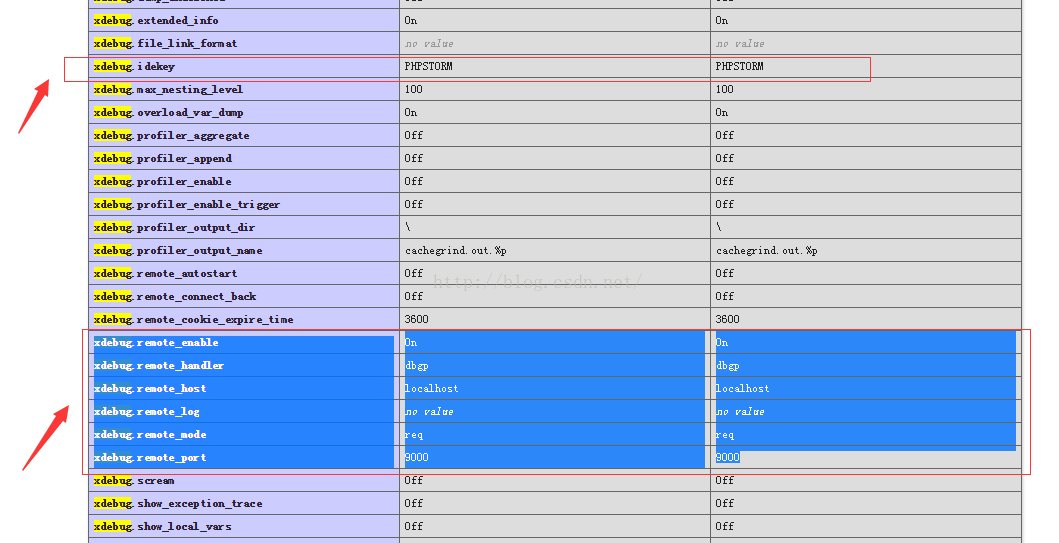 【或者使用PHPstudy:其他选项菜单/PHP扩展设置/PHP扩展/XDEBUG打上对钩】 ### 2.PHPSTORM设置
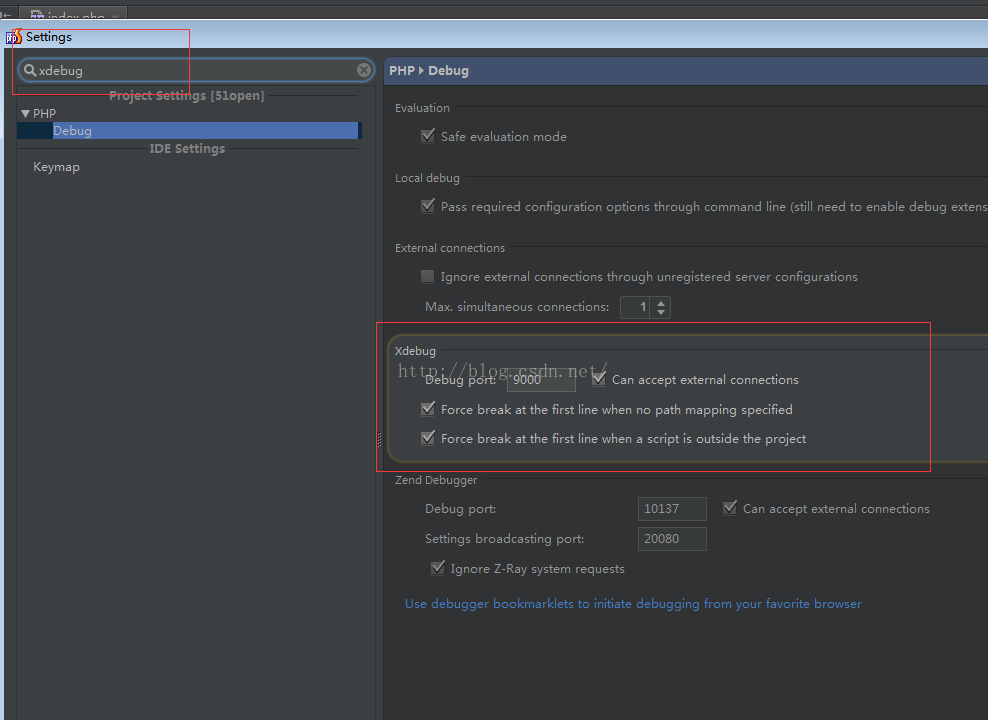
楼主以前一直用zendstudio,刚开始用phpstorm非常蛋疼,用了一段时间后发现还挺好用的~ 1.首先检查phpstorm的xdebug配置 这里的debug port要和php.ini里面的xdebug.remote\_port相一致!默认是9000,如果9000端口被占用的话,可以改成其他端口。 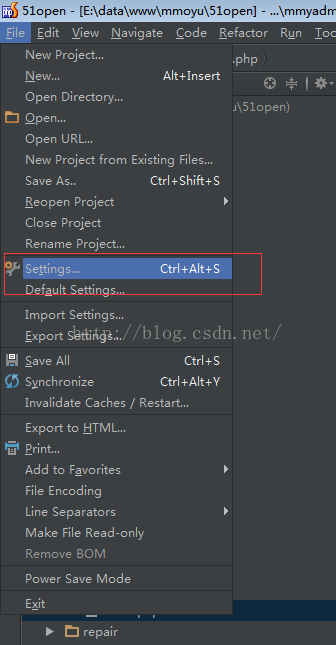
phpstorm配置 - 客户端调试,打开phpStorm,进入File>Settings>PHP>Servers,这里要填写服务器端的相关信息,name填localhost,host填localhost,port填80,debugger选XDebug
- 进入File>Settings>PHP>Debug,看到XDebug选项卡,port填9000,其他默认
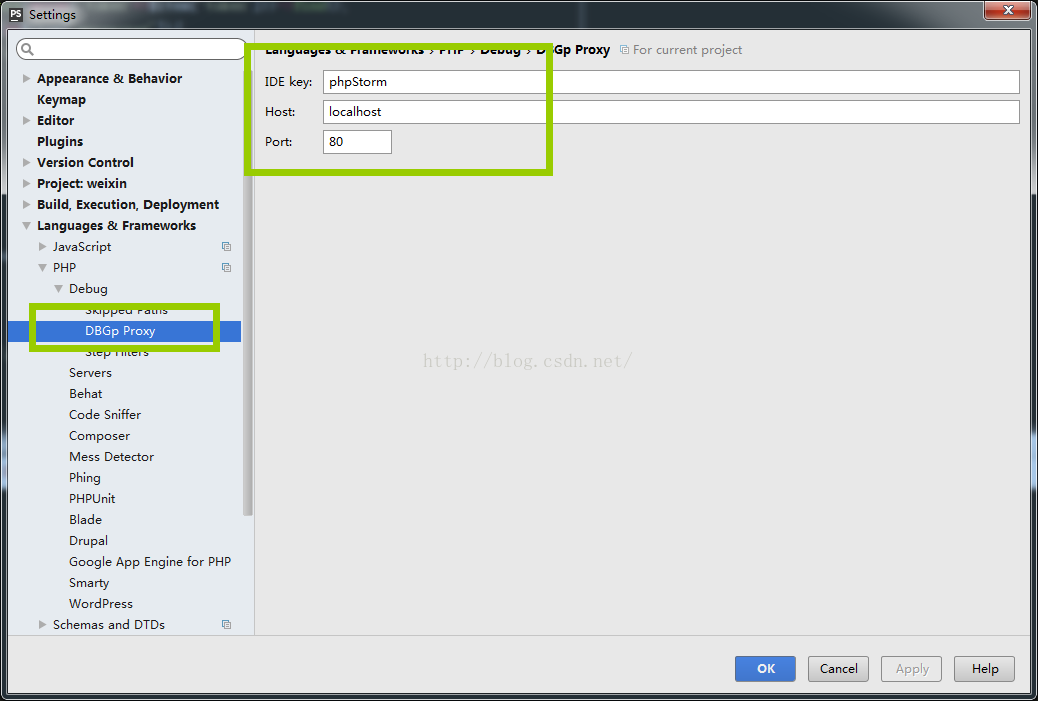
- 进入File>Settings>PHP>Debug>DBGp Proxy,IDE key 填 phpStorm,host 填localhost,port 填80
点OK退出设置。
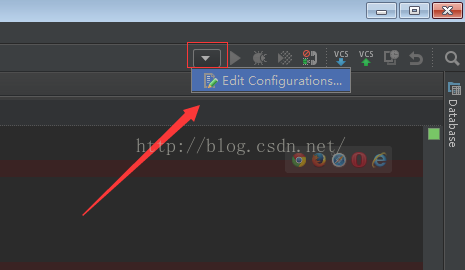
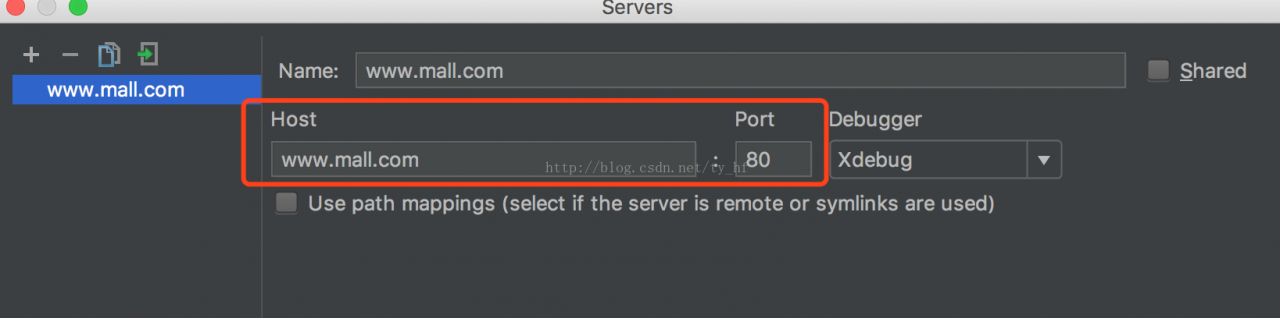
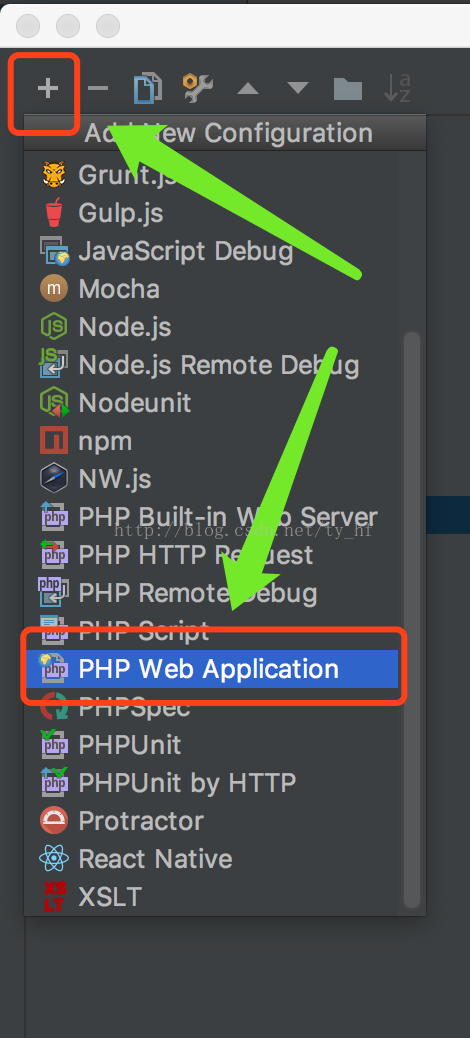 添加本地的 web server~ www.mall.com是我本地的服务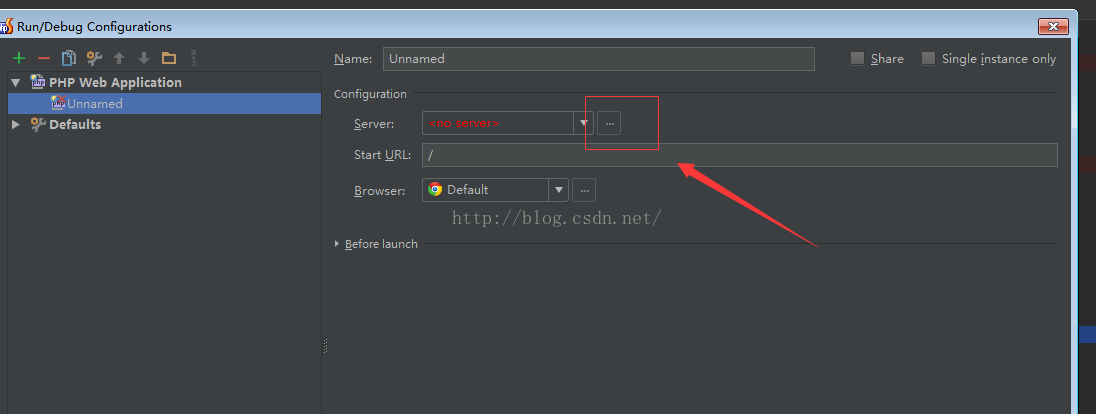
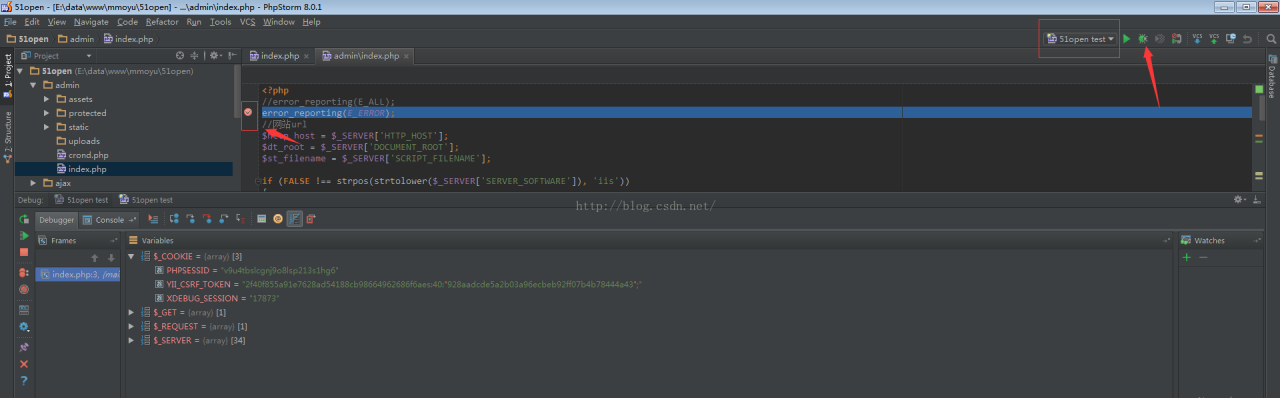
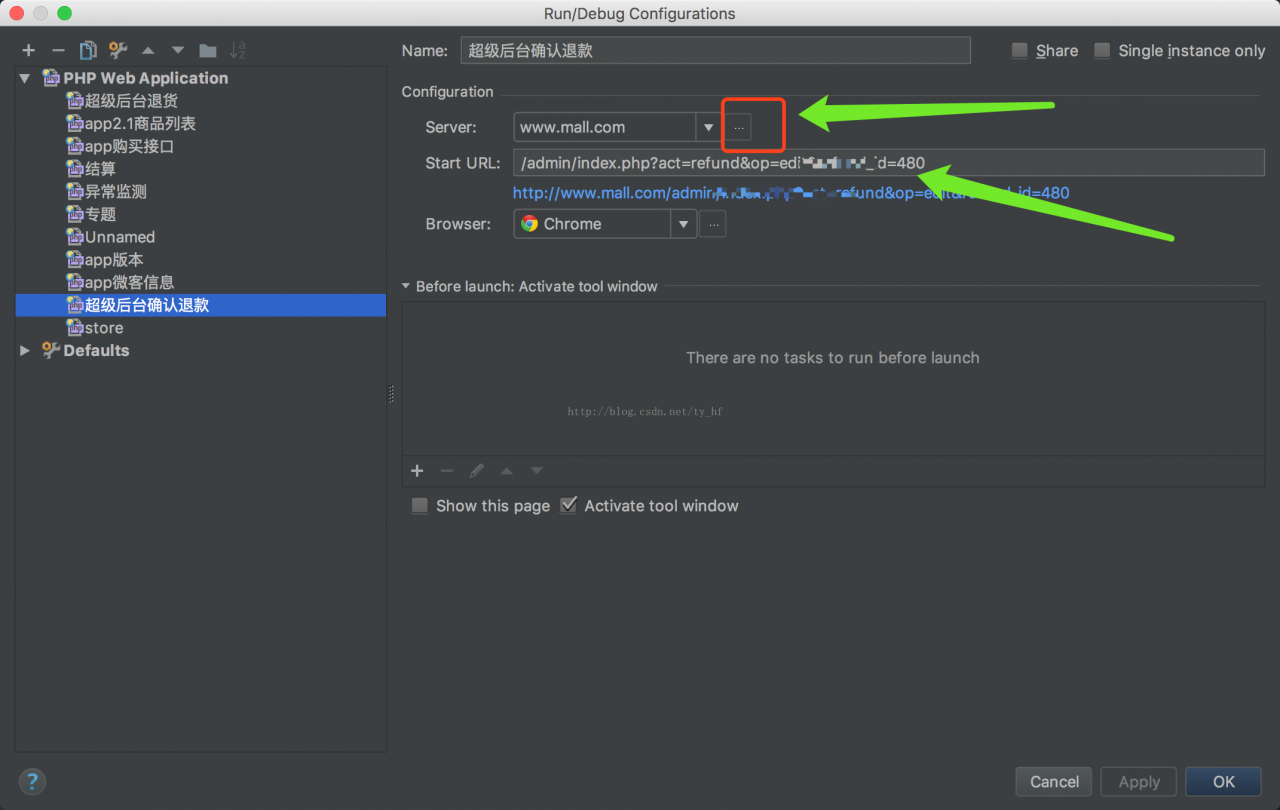 3.开始调试 1. 打好第一个断点,shift + F9就可以了
打好第一个断点,选中配置的debug, 按旁边的臭虫 按钮
 或者还是看不懂,好吧,那请看下面链接: http://wenku.baidu.com/link?url=osFXlDZtbYW2yOxJYwKukXButWW647d2d87-d69F56FmbU1Wi7YNK-KCGcrL-car-o1U\_r2Y0xkXnqoZw2I87FsKdMb7Z9N9pZZvB1a8Lrq 常见问题:
 Debug session was finished without being pausedIt may be caused by path mappings misconfiguration or not synchronized local and remote projects.To figure out the problem check path mappings configuration for 'www.test.com' server at PHP|Servers or enable Break at first line in PHP scripts option (from Run menu). 没有打断点或者调试没有被监测到,碰到这个问题,看看路径配置对了吗是否能访问到
评论1
暂时没有评论